A quick guide to using the Layers panel
The Layers panel ![]() displays the list of layers available and allows you to change the order, transparency and choose which layers are displayed on the map.
displays the list of layers available and allows you to change the order, transparency and choose which layers are displayed on the map.
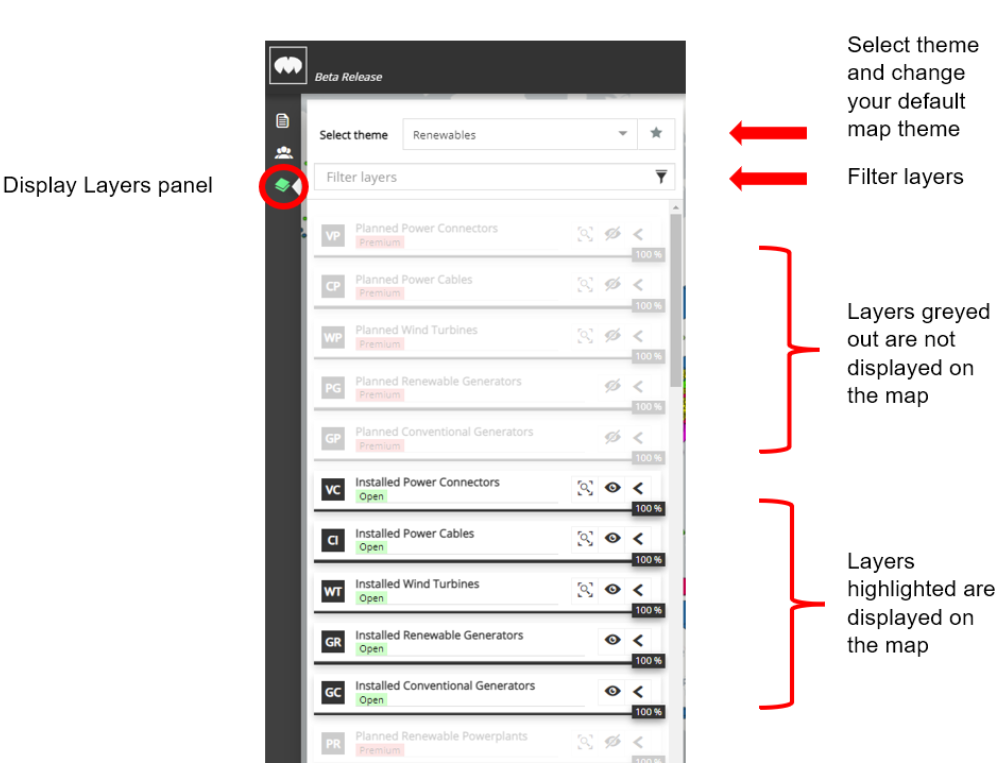
To access the Layers panel (see image below) select the Layers panel button![]() on the left hand side of the platform.
on the left hand side of the platform.
The layers highlighted in the Layers Panel (and displayed on the map), are the pre-selected layers that represent your default map theme (Renewables or Oil and Gas) plus any other layers you've switched on.
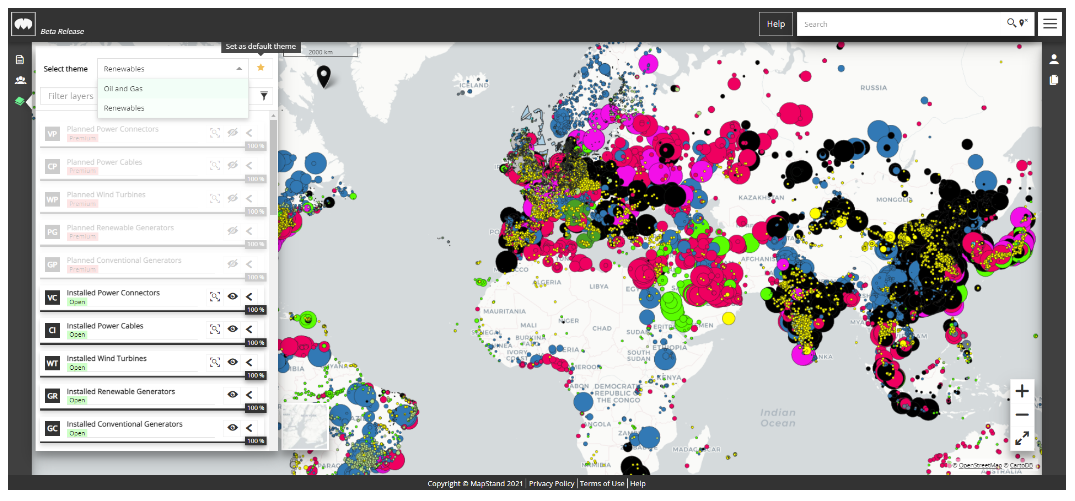
Change your Default Map Theme
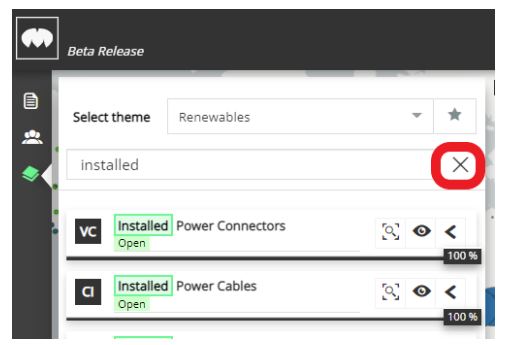
To change your default map theme (a pre-set list of layers), open the Layers panel and simply select either Renewables or Oil and Gas from the Select Theme drop down menu. Click on the star to set this selection as your default map.
Filter Layers
To find layers quickly - start typing the name of the layer you want to find in the filter layers box of the Layers panel (highlighted in the image below). The layers are filtered as you type.
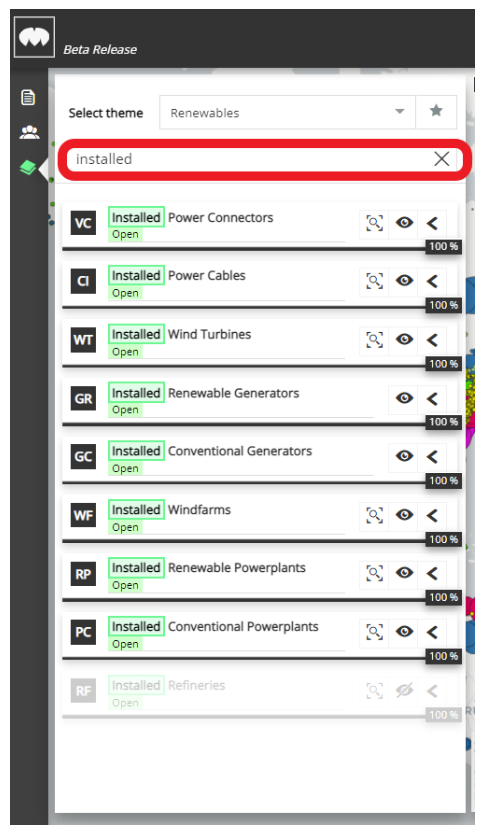
Click on the “X” to cancel the filter and list all layers again.
Turn Layers ON and OFF
The  symbol allows you to turn individual layers on and off.
 = ON
= ON
![]() = OFF
= OFF
Zoom to Layer Extent
The  symbol allows you to zoom the map to the extent of the data for that layer.
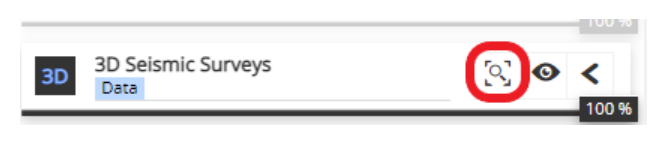
Top Tip: If the ![]() symbol is missing, this means there is no data available for that layer.
symbol is missing, this means there is no data available for that layer.
Display the Layer legend
To display the key or legend, click on the  symbol on the right hand side of each layer. The
  symbol changes to
  and the legend/key is displayed. In this example the Accumulation layer is colour coded to show the hydrocarbon type.
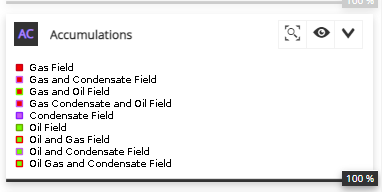
The legend displayed depends on the layer selected.
To hide the legend again click on the ![]() symbol.
symbol.
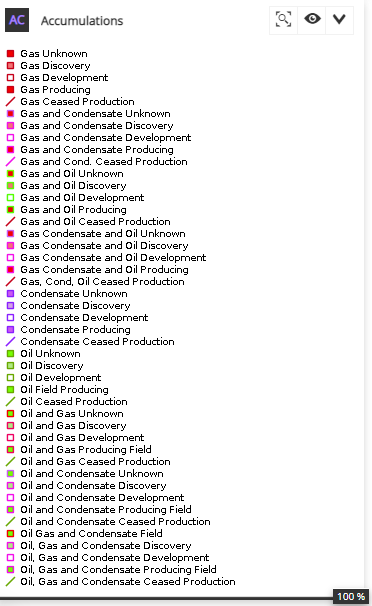
Top Tip: Some layers have scale dependent visibility. The legend or key is dynamic so will only show what is currently displayed. If the map scale is too large (e.g. scale bar > 2000km) then these layers will not be displayed, even when they are switched on. Also, if you try to view the legend, you will see the words "Legend is not available". To find out more click here.
The Accumulations layer is an example of a layer with scale dependent visibility - displayed on the map when the zoom to scale bar = 200km. Also, when the zoom to scale bar = 20km or less, the map changes to display accumulation type as well as hydrocarbon type as per the legend in the image below.
Change the order of Layers
To change the order of layers, you can drag and drop layers easily. Click on the layer you want to display on top, then drag it to the position above the layer that is obscuring it. Alternatively, click on the layer that is obscuring the layer you want to see and drag it below the layer you are interested in.
Change the transparency of Layers
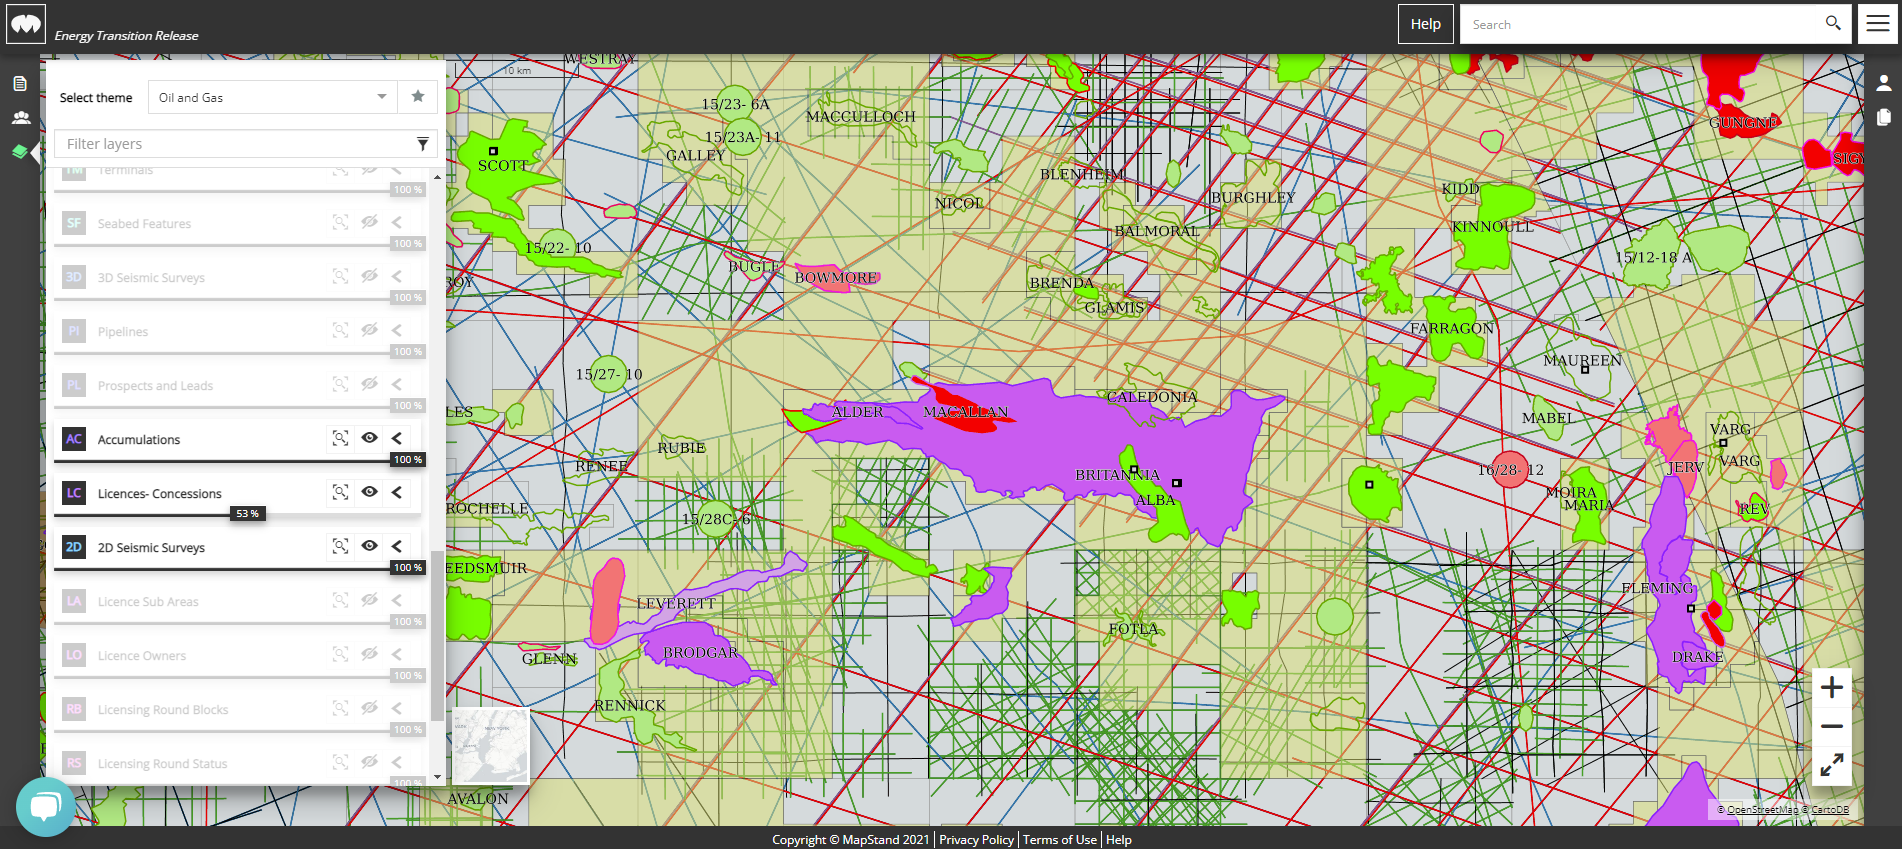
Lastly, you can increase the transparency of each layer by moving the slider bar
to the left. To reduce the transparency again, move the slider to the right.
In the example below, I have increased the transparency of the Licenses/Concessions layer to 53% allowing me to see the 2D seismic survey layer underneath.